Income Statement
Last updated: June 29, 2026
Campfire’s Help Center has moved. As of June 2026, this article is no longer being updated. Find the latest version in our new Help Center: view here.
The Income Statement gives you a real-time view of your company's revenue, expenses, gains, and losses over any time period. It follows the standard P&L structure — Revenue, COGS, Gross Profit, Operating Expenses, Operating Income, Other Income/Expense, and Net Income — and can be sliced, grouped, and filtered to match how your team analyzes the business.
Getting Started
Navigate to the Income Statement Report by navigating to:
Reporting -> Income Statement
When you open the Income Statement, Campfire automatically loads your most recently saved view. If you haven't saved any views yet, it defaults to last month's data at a monthly cadence.
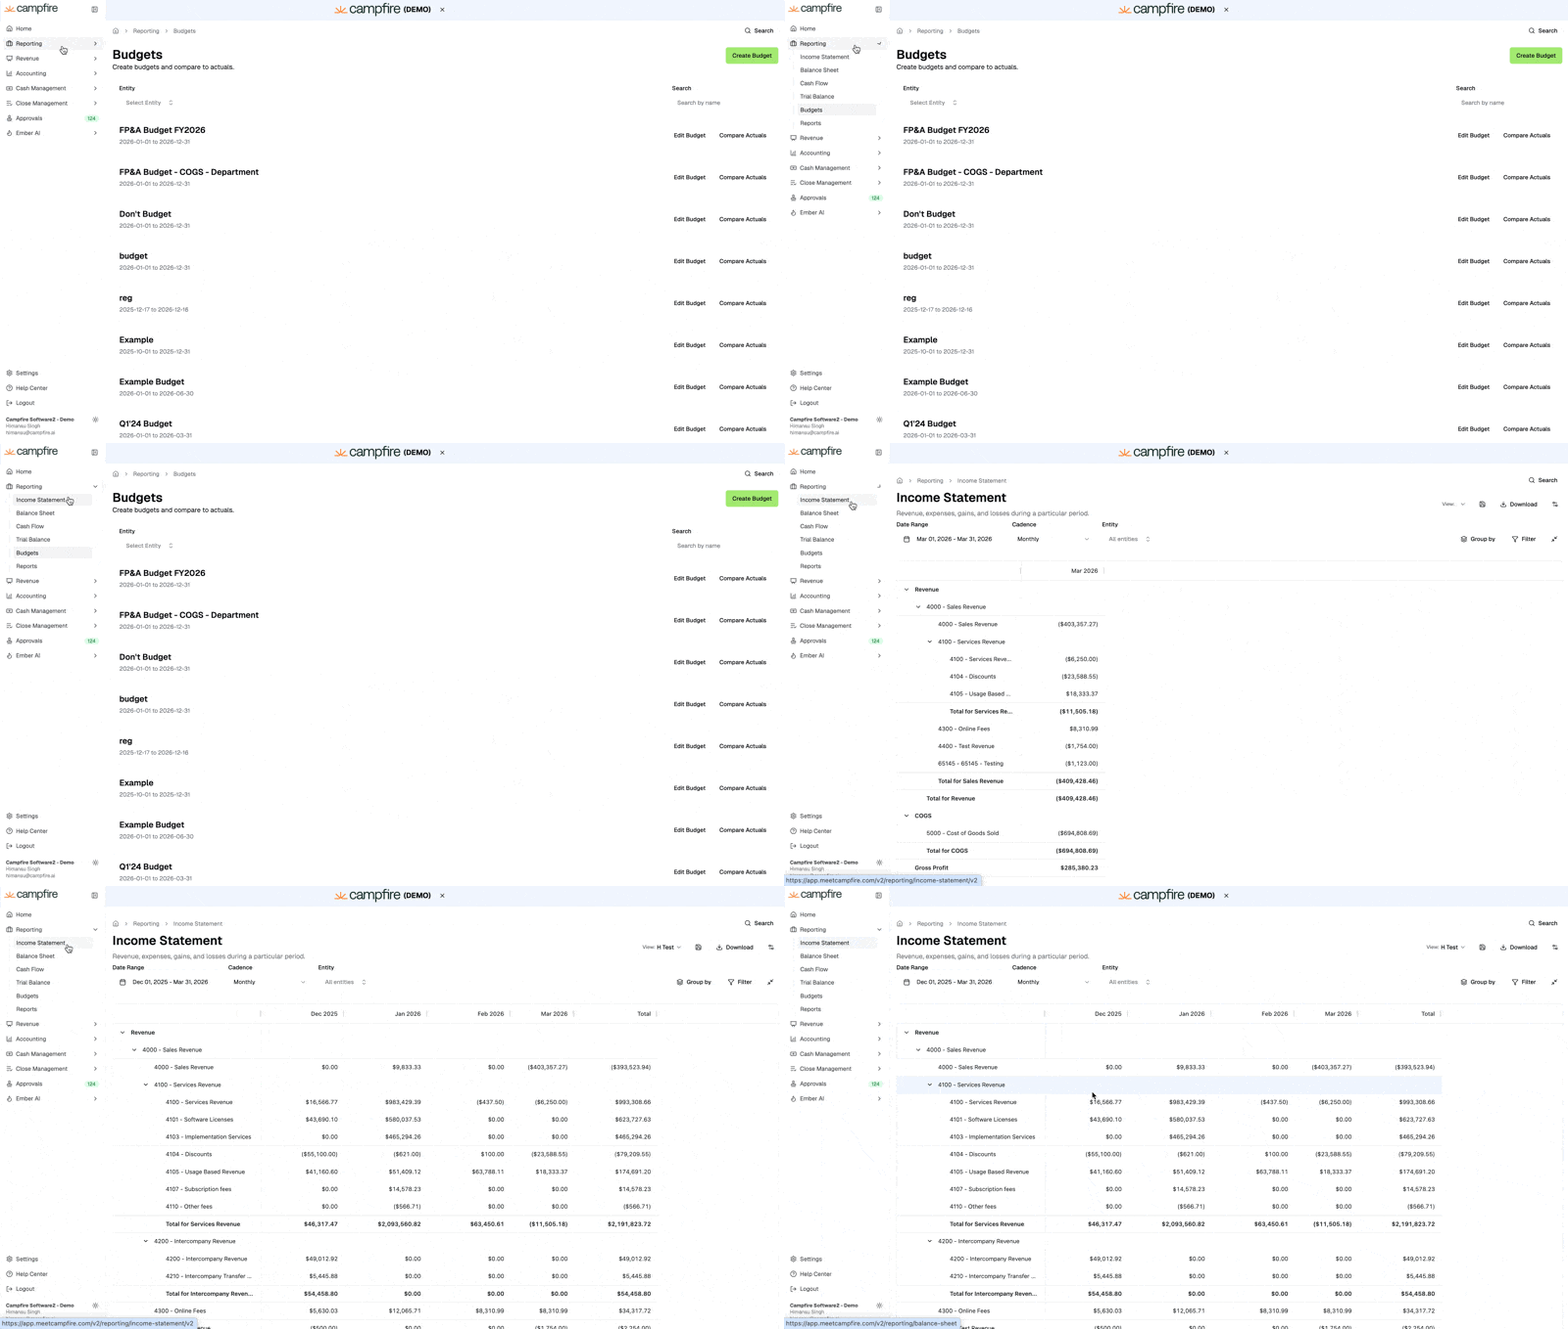
Setting Your Date Range
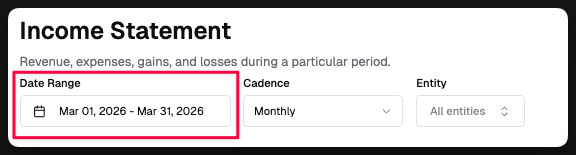
Use the Date Range picker at the top left to select the period you want to analyze.
A few things to know:
The Income Statement always covers complete calendar months. If you pick an end date that isn't the last day of a month, Campfire will automatically extend it to month-end — a small info icon will appear next to "Date Range" to let you know.
To run the report for all time, leave both date fields blank (or clear them).
Choosing a Cadence
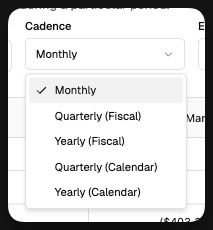
The Cadence dropdown controls how columns are grouped across your selected date range.
Cadence | Description |
Monthly | One column per month (default) |
Quarterly (Fiscal) | One column per fiscal quarter |
Yearly (Fiscal) | One column per fiscal year |
Quarterly (Calendar) | One column per calendar quarter |
Yearly (Calendar) | One column per calendar year |
Filtering by Entity
The Entity picker lets you narrow the report to one or more specific entities, or leave it set to All Entities for a consolidated view.
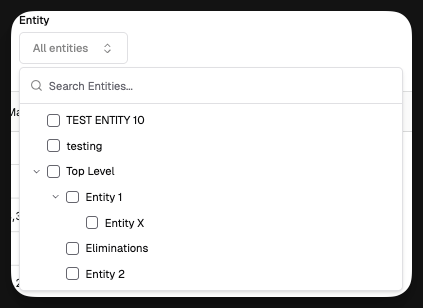
When you select a single entity, a checkbox appears to switch into Entity Currency mode — this shows amounts in that entity's functional currency rather than your organization's root currency. If the entity's currency already matches the root currency, this toggle is disabled.
Grouping Your Report
Click Group By in the top right to open the grouping panel. A badge shows how many groupings are currently active.
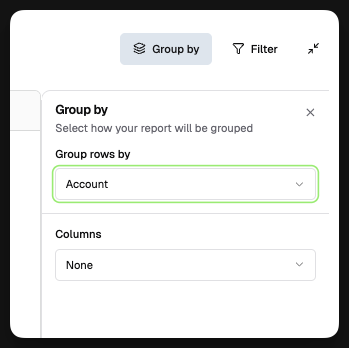
Group Rows By
Choose how the rows in the report are structured:
Account (default) — standard P&L view grouped by account
Department — rows broken out by department
Department - Parent — rows broken out by top-level department
Tag Group — any of your configured tag groups
When you group rows by Department or a Tag Group, you can optionally add a Subgroup by Account layer underneath — giving you a two-level breakdown (e.g., Department → Account within each department).
Group Columns By
Choose how columns are split across each period:
None (default) — one total column per period
Name — split by payee or vendor name
Department — split by department
Entity — split by entity
Tag Group — split by a specific tag group (you'll choose which one)
Currency — split by transaction currency
Filtering Your Data
Click Filter in the top right to open the filter panel. A badge shows how many filters are active.
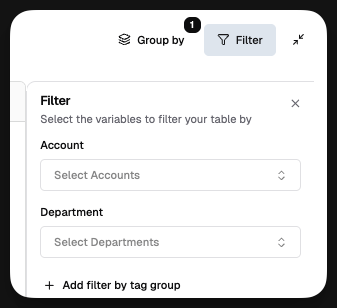
You can filter by:
Account — narrow to specific GL accounts
Department — narrow to specific departments; includes an "Other" option for transactions with no department assigned
Tag Group — filter by one or more tag groups and specific tags within each; click + Add filter by tag group to layer in additional groups
Applied filters appear as removable chips directly in the filter panel.
Expanding and Collapsing Rows
Use the expand/collapse icon (top right, next to Filter) to expand all rows to account-level detail or collapse them back to section totals. You can also expand or collapse individual rows by clicking them directly in the grid.
Drilling Into Transactions
Any account-level cell in the grid is drill able. Clicking a cell opens the Transactions page pre-filtered to the exact account, period, and any active groupings or filters — so you can drill directly into the underlying journal entries.
Exporting to Excel
Click Download (top right) to export the current view — including all active groupings, filters, cadence, and date range — to an Excel (.xlsx) file.
Saving Views
Views let you save and instantly return to any configuration of date range, cadence, groupings, and filters.
Click the view selector (top right) to see your saved views
Click Save View to name and save the current configuration
Load an existing view and click Update to save changes to it
Rename or delete views from the view menu
Reorder views by dragging them
When you open the Income Statement without any URL parameters (for example, by clicking it from the nav), Campfire automatically loads your first saved view.